BACK TO WEATHER-BLOG MENU
New! Fine Art Prints & digital images for sale-
Welsh Weather & Dyfi Valley landscapes Slide-Library - Click HERE
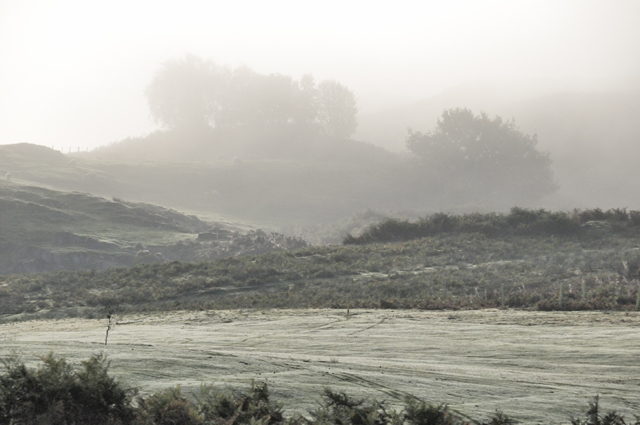
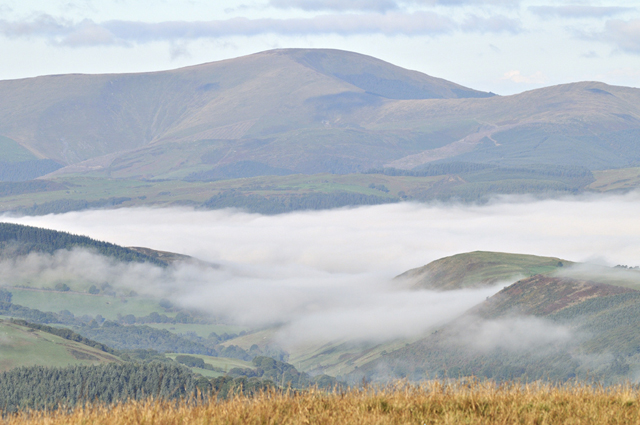
Up on the mountain road, conditions above the fog were a bit hazy, but this was the view of Dinas Mawddwy and the upper Dyfi valley....
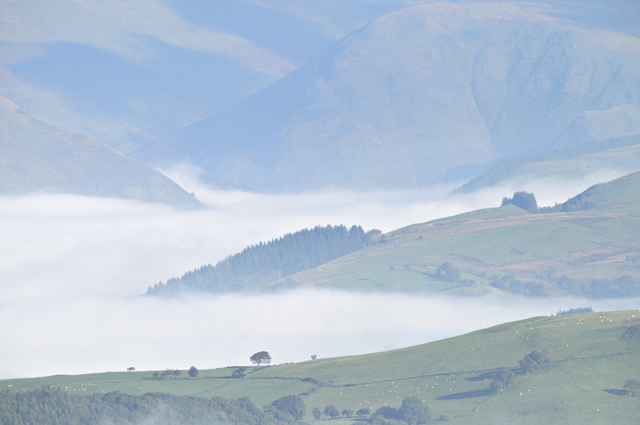
Machynlleth, still beneath the fog, with Tarrenhendre forming the backdrop...
On the same day, the veg-garden was full of small tortoiseshells...

A few days later conditions turned very unsettled with a huge area of low pressure just to our west throwing fronts and troughs across the UK. Several opportunities presented themselves for intercepting convective storms as they rolled in from the sea, with mixed results as variations in moisture determined the amount of low-level clag getting in the way of cloudscapes. Some days were better than others. The 19th was poor but for a vivid low-angle rainbow over Aberdyfi Bar...
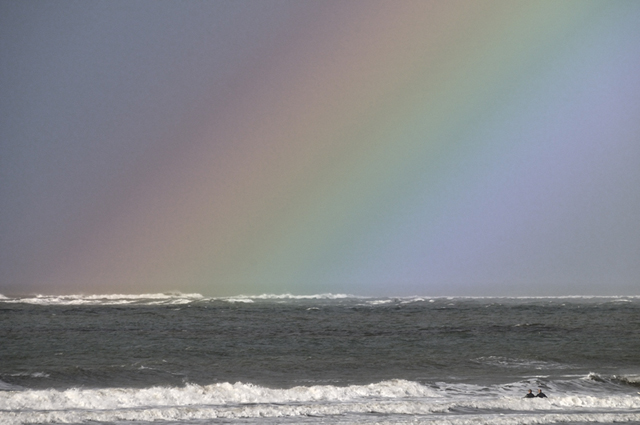
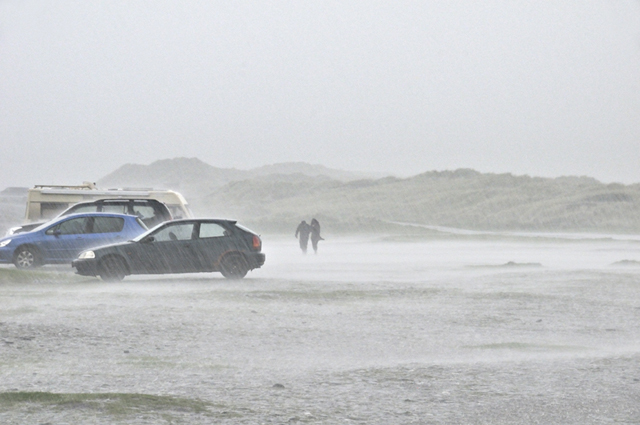
...and this fortuitous shot of two people getting blasted by a tremendous cloudburst - this is all rain, not hail! It was so heavy that, although visible lightning strikes occurred, I couldn't hear the thunder because of the noise the rain was making on my roof!
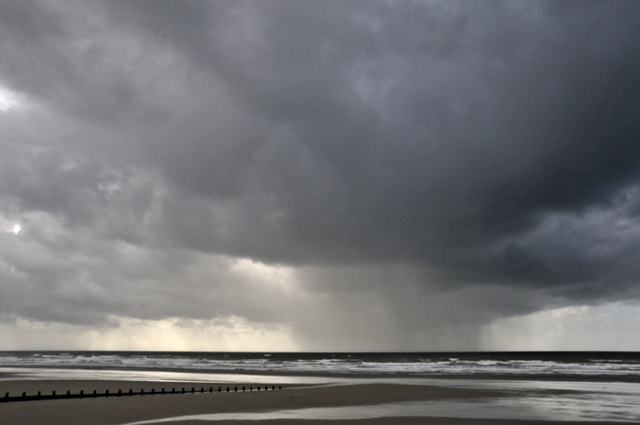
Clearer skies welcomed me on the 20th. High windshear and good instability suggested tornadoes could be possible and TORRO issued a tornado watch for most of England and Wales, which came up trumps with one doing a lot of damage on Hayling Island on the South Coast. Here, a late afternoon visit to Ynyslas saw numerous heavy showers breaking out over the sea....
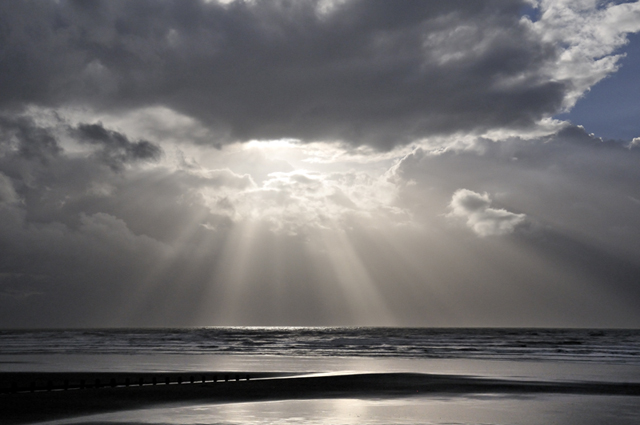
...with the sun doing some excellent starburst effects at times....

One of the heavy showers developed an interesting but ultimately unproductive lowering in its updraught area...
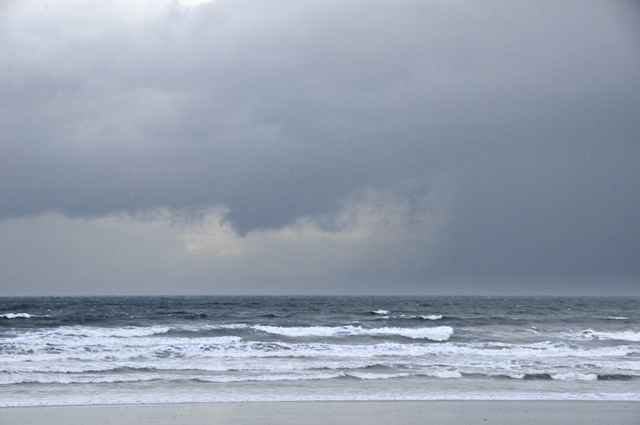
Zoom-out of the same line of storms during a break in the cloud, revealing solid-looking anvils...
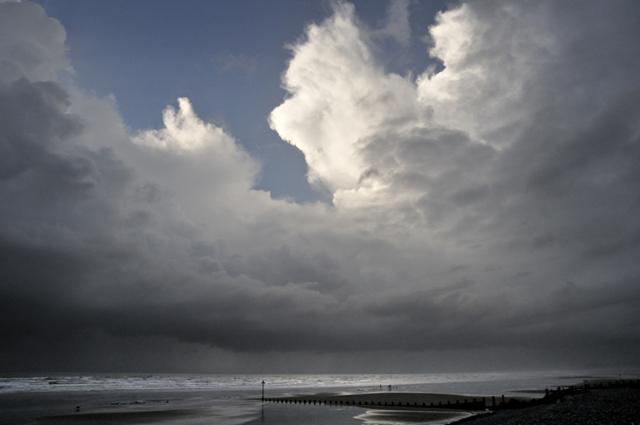
The high shear is evident in this image: the storm is moving left to right but its anvil-cirrus is streaming off leftwards, filling the sky in that direction.
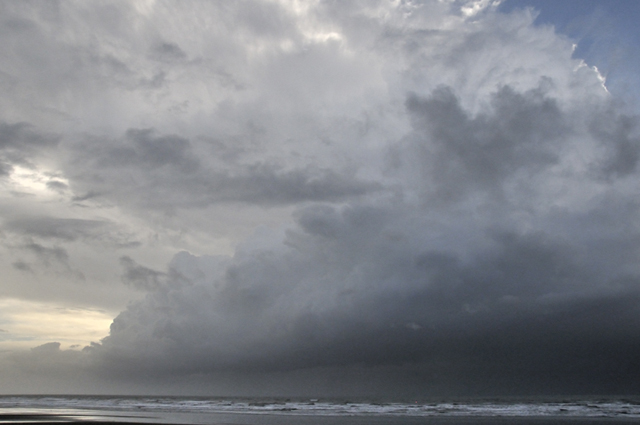
Again some intense downpours were encountered. This one had a strong gust-front in association - the arc-shaped low cloud racing ahead of the rain-core, where rain-cooled air is hitting the ground and spreading out in front of the storm, lifting the air as it does and forcing its moisture to condense:
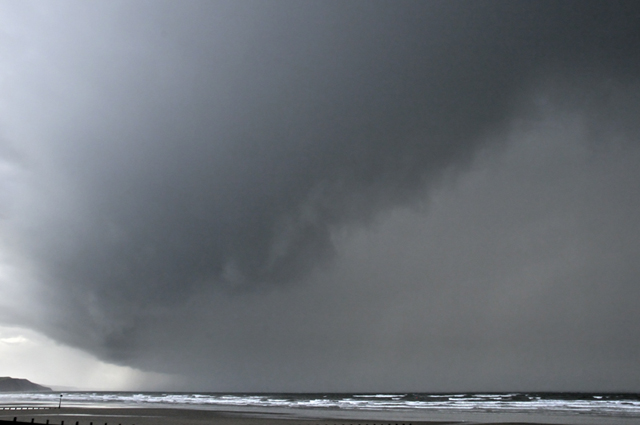
Getting closer...
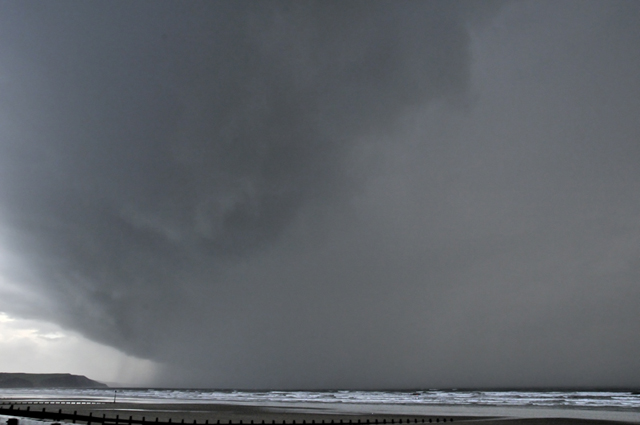
Precipitation moving off, revealing the inside of the gust-front cloud through the residual rain...
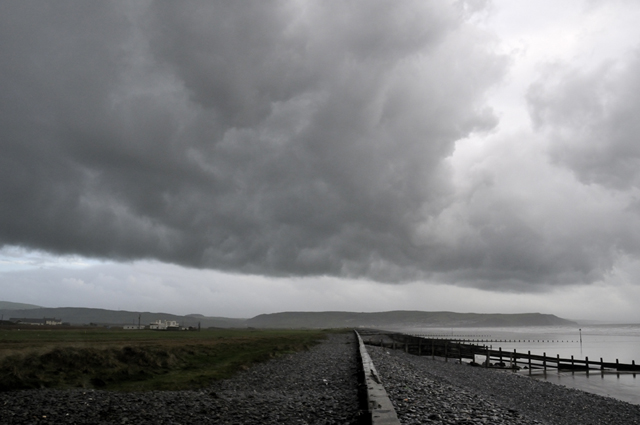
As the rain ceased, the inside of the gust-front revealed characteristic structure and hue....
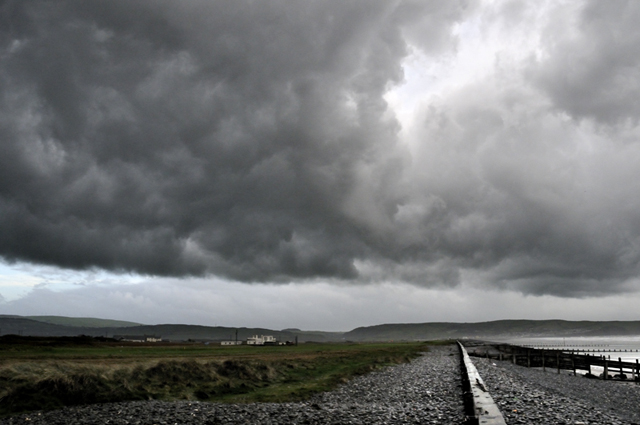
On other days, the convective activity was weaker...
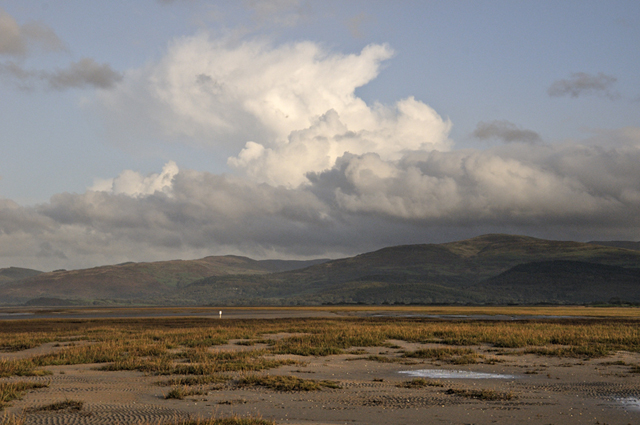
....but October 25th looked especially good in terms of instability and shear. Expecting good things, and with another TORRO tornado watch issued, and noting a series of storms heading up from the south on the rainfall radar, I arrived at Ynyslas at 1330 and heard the first thunder just twenty minutes later. This beast was the culprit:
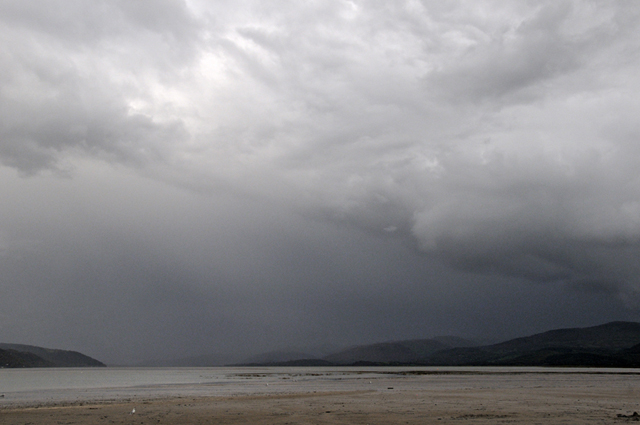
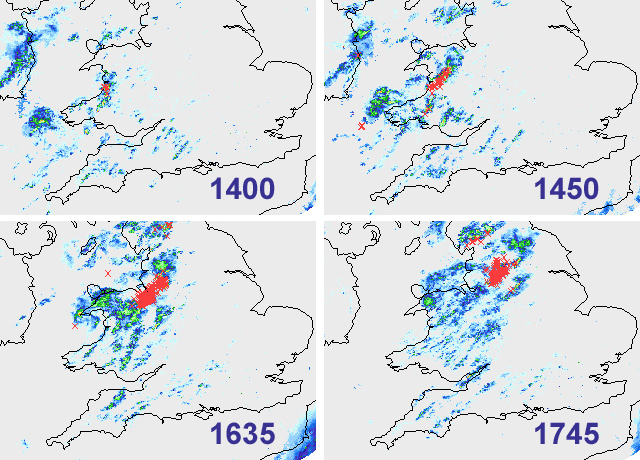
The lightning became frequent and its static bursts on AM radio became almost continuous as it moved off to the north-east. Here are radar plots with lightning indicated by red crosses. This storm, which initiated in Carmarthen Bay, travelled all the way to the North Sea: it produced several tornadoes, some quite strong, in the process, with reports of damage-swathes in parts of Cheshire and Yorkshire. Flash-flooding was also reported in places. The long track and repeated tornado activity both suggest that this was a supercell.
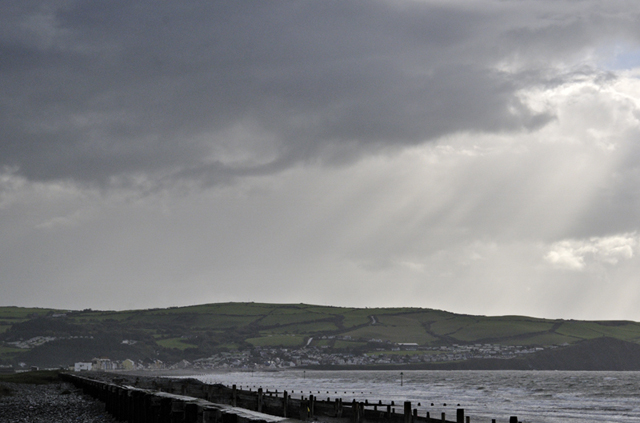
Here, not to be outdone, its tail-end sported a funnel-cloud for a while, albeit not especially photogenic and part-obscured by low scud:
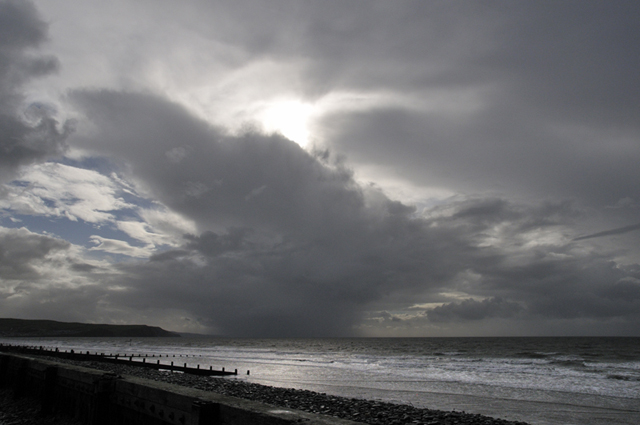
For much of that afternoon, low cloud was in the way, but a break gave a striking view of this storm moving up the coast: it was heading straight for me but again the high shear is demonstrated by the shape of the anvil, with its cirrus spreading out leftwards....
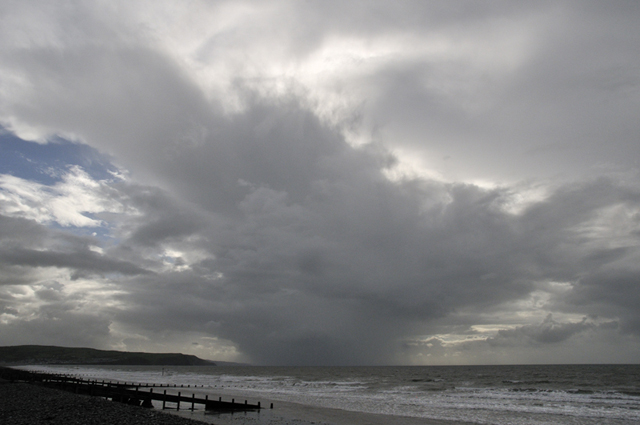
As it approached, though, it began to weaken as the best shear and instability departed the area and headed off north-eastwards...
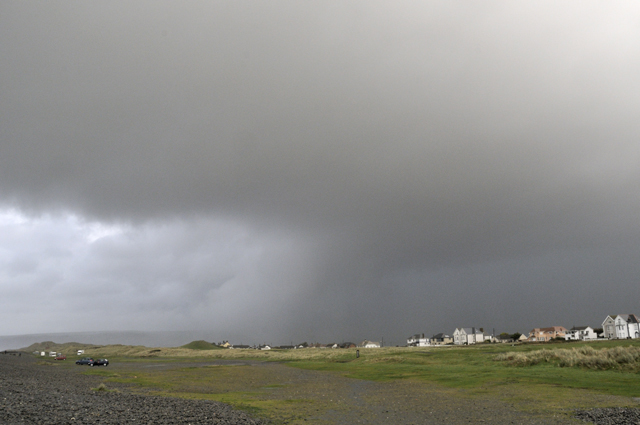
The 27th saw thunderstorm activity during the morning but conditions were very murky, although again very heavy rain was encountered....
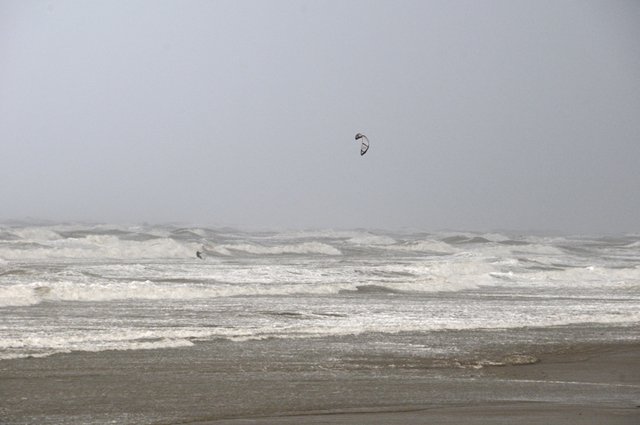
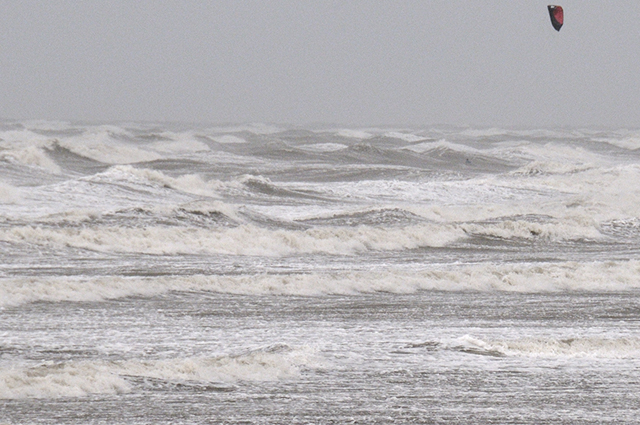
The sea made up for it, with a gale blowing and a huge swell running. Foam was blowing up like snow and the UV filter on my camera was soon caked in salt-spray. Before that, though, I got a few shots of these two kite-surfers tackling what must have been difficult conditions, and at times obscured by the enormous waves...
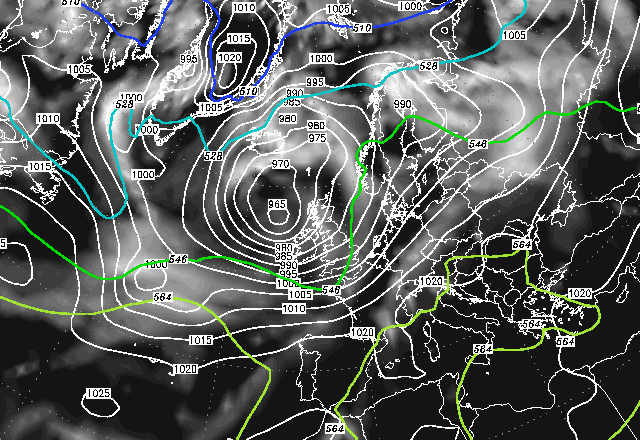
So to the major storm of October 28th. This was first picked up by the forecast models several days beforehand, well before it had formed. Beginning life as a shallow low off the Newfoundland coast, it was forecast to race across the Atlantic, deepen significantly and track straight across the UK. Here it is, plotted on a surface pressure chart, issued at 00z on the 26th for 0600 on the morning of the 27th - at 1000 mb, forming a satellite low deep on the SW flank of a large and deep (965 mb) depression centered just to the NW of the UK:
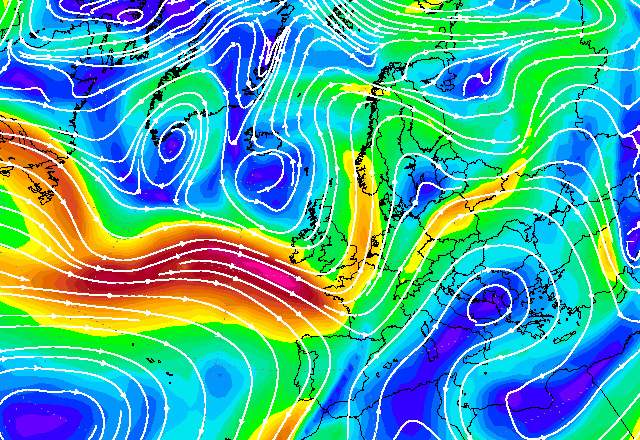
This chart (same issue/forecast times) depicts the properties of the jet stream, at the 300hPa height (about the same as the summit of Everest) at the time. The Polar Jet is the green to red belt of high winds that encircles the Arctic at altitude, marking the boundary between the cold Polar air and the warmer air to the south. This is the battle-front along which Atlantic depressions tend to develop, and at the time a very strong jet-streak was present - the pink-shaded region has winds of over 150 knots. But the important feature here is the downward buckle in the jetstream in the left-hand part of the chart. This is an upper-level trough - an area of low pressure in which cold air is pushing south. In the Northern Hemisphere, upper troughs (and ridges) constantly move from west to east. The zone to the east of the trough axis is one in which mass-ascent of air occurs: coincidence of that zone of an upper trough with either shower activity or an area of low pressure results in explosive development with showers developing into vigorous thunderstorms, whilst low pressure systems deepen dramatically.
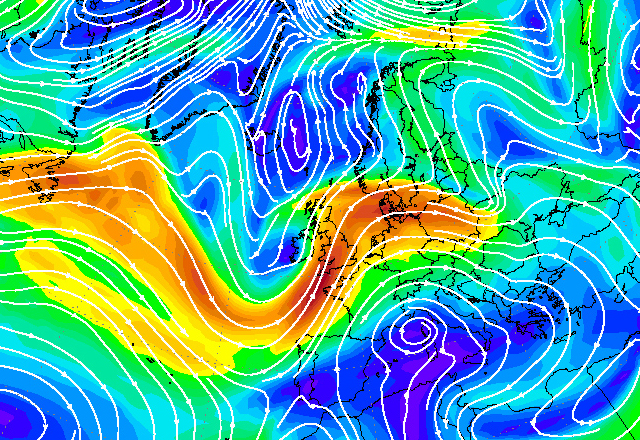
That trough was of vital importance in the evolution of the outcome. This chart (same issue time, but for 0600 on the 28th) shows the upper trough was forecast to deepen considerably as it moved eastwards...
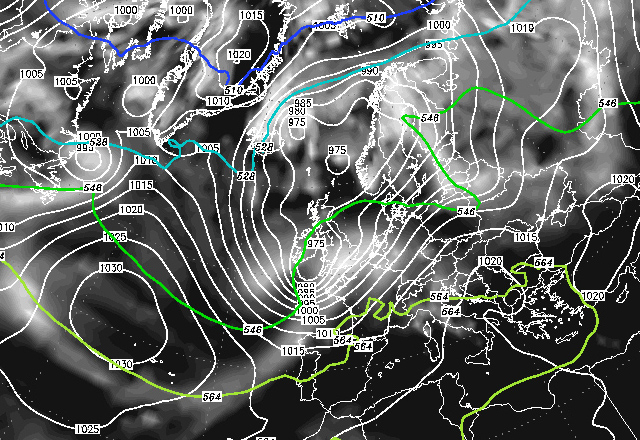
The surface pressure-chart (same issue/forecast times) shows the low has deepened to 975 mb at 0600 on the 28th and has a very tight pressure-gradient marked by the isobars on its southern flanks, whilst to the north of its centre the pressure is much slacker. This translates into storm-force winds on its southern side but light winds to its north. Its exact track would determine just where the storm-force winds would occur: it seemed on the morning of the 26th that it would track straight across Wales and head into the North Sea somewhere near the Humber Estuary. This would bring a damaging storm across southern England and south Wales, and especially to the far south of England, but with no problems further to the north except those associated with heavy rain...
Several days before the storm had arrived, the media, largely ignoring the forecasts and their clearly-written caveats, went into hyperdrive: 'Armageddon', 'mega-storm' and so on were liberally banded about the headlines and widespread 100mph gusts were gleefully predicted to affect the country: another 1987 Great Storm was to be expected and so on. It's hard to single out any one media outlet for particular criticism: the Daily Express was one of the worst offenders but it alternates nonsensical weather-stories with Princess Diana and booming house-price predictions on a routine basis, as most people have come to realise.
Back to reality: on the 26th the Met Office issued an Amber warning for strong winds that would lead to falling trees. With the trees in full leaf and the ground sodden, it doesn't take much to blow them over. Warnings are on a threefold scale. A Yellow warning (issued October 24th) means: be aware. Being aware, in my humble opinion, is generally a Good Thing. It's a kind of "watch your back, sunshine". An Amber warning means: be prepared. It's a kind of "don't put yourself in a situation where you have to constantly watch your back". A Red warning means: take action. This may involve, where possible, ducking.
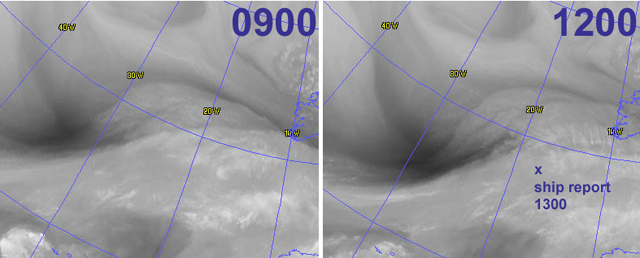
By the 27th the likely outcome on the 28th was becoming more evident. The low was getting a bit too far ahead of the upper trough for its own good, thereby inhibiting its development. Some forecast models simply brought it across the UK as an open wave with no central circulation, whilst others (and it needs to be said that the Met Office's own suite of models did the best job by far) kept the circulation with explosive deepening occurring as it headed into the North Sea. However, it was now possible to nowcast, with satellite imagery and reports from buoys and ships helping to track developments out in the Atlantic. Here are water vapour satellite images from the 27th: the upper trough is the dark vaguely u-shaped area and the developing low is somewhere to its east where there is a northward-projecting head of somewhat striated cloud. By 1300, strong pressure-drops were being reported out in the Mid-Atlantic: wave-buoy K1 reported wind backing from 230 to 210 degrees, pressure 999 and falling whilst a nearby ship reported a faster pressure-fall: values suggested the low was slightly deeper than most models had suggested.
By the early hours of the 28th the storm had arrived, with its centre tracking a little further south than predicted - by a matter of a few tens of miles, a distance below the resolution of the models. It tracked up the Bristol Channel to be centered over Gloucester by 0200:
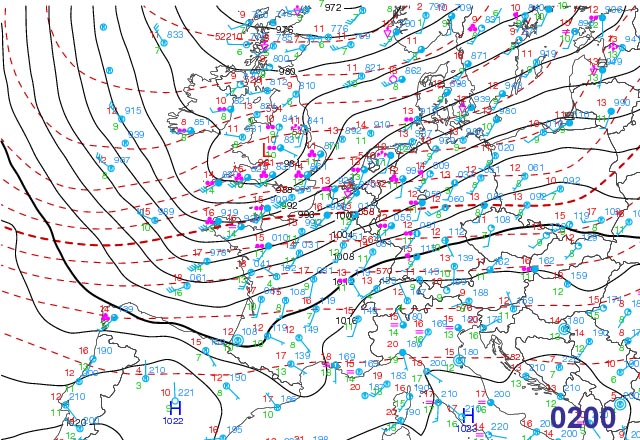
By 0400 the deepening was underway with a centre at 977 mb over the Cotswolds and strong winds affecting SW England and especially the English Channel and coastal areas on either side. Channel Light Vessel, moored in the English Channel approximately between Jersey and Torquay, reported steady winds of 61mph, or Violent Storm Force 11 on the Beaufort Scale.
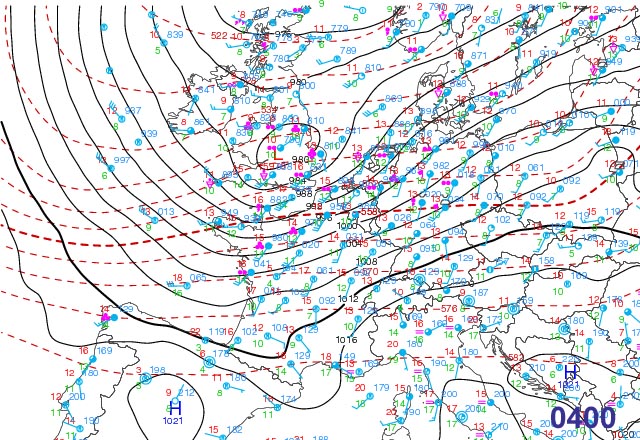
The 0600 analysis shows the isobars tightening considerably on the south side of the low centre. It was clear that, although damage reports were coming in widely over southern counties, SE England was going to see some major problems in the coming couple of hours. Notably, at locations along the south coast, massive steady wind-gust variations were being reported, for example Lyneham reported wind 29mph, gust 75mph whilst Hurn recorded wind 25mph, gust 74mph. These were an ominous sign of the possible developing presence of a sting-jet. This is the phenomenon that caused such mayhem in the 1987 storm: essentially high-speed upper-level winds are forced down to the surface, but in short bursts: what you get is huge, sudden gusts that are, weirdly, separated by periods of relative quiet.
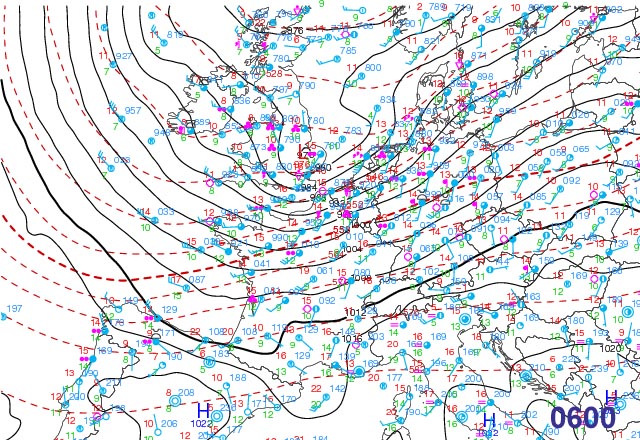
Such gusts were being recorded across SE England by 0700. Fortunately the ordeal was short-lived: by 0800 the centre of the deepening low was in the North Sea off the Wash. Sandette Light Vessel, anchored between Dunkirk and Dover, recorded steady winds of 62.9 knots at 0700 and 61 knots at 0800 - that is approaching hurricane force, with a gust in the hour to 0700 of 91 knots or 104mph. Other top gusts were as follows:
Needles (IOW) 99mph
Portland Harbour 98mph
Hurst Castle 90mph
Worthing Pier 83mph
Chichester Bar 82mph
Langdon Bay, Dover 81mph
Portland Isle 80mph
Andrewsfield 80mph
St Ives 78mph
Odiham 78mph
Shoreham Beach 77mph
Thorney Island 76mph
Wattisham 76mph
Southampton Docks 76mph
Lymington 76mph
Lynham 75mph
Yeovilton 75mph
Rame Head 74mph
Inland, 60-70mph gusts were widespread in the SE with, sadly, four associated fatalities, a number of people injured, over 250,000 homes and businesses without electricity and scores of blockages of roads and railways.
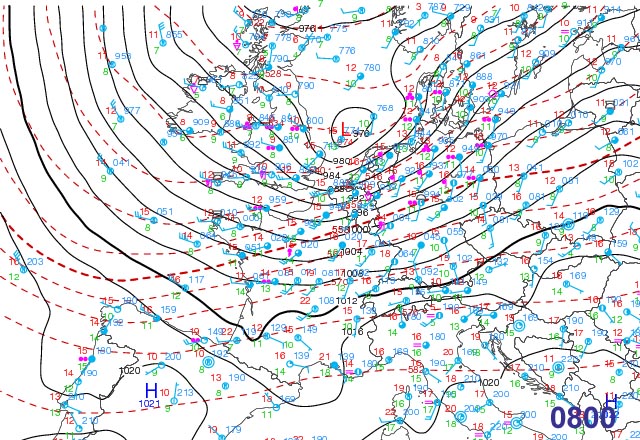
The explosive deepening of the low that had started as it moved across the UK continued apace over the North Sea. It is absolutely clear that we dodged a bullet here. Had the upper trough/jet-low engagement occurred earlier on, this deepening could have been well underway at the time the low was in the south-west approaches and everywhere south of a line from the Bristol Channel to the Wash would have had a comprehensive mauling.
By 1200, ferocious winds had set into the Netherlands and northern Germany: off the German coast a gust of 119mph was recorded, and widespread damage occurred, bringing the death-toll to 16 in total:
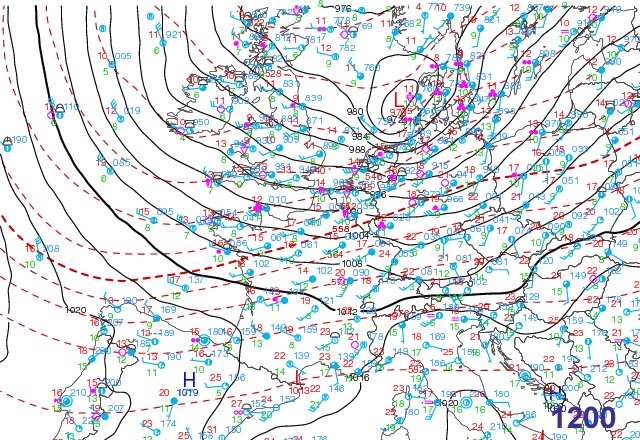
By 1600, the low was over Denmark: it finally started to fill from a minimum pressure of just under 970mb during the evening as it crossed the Baltic Sea....
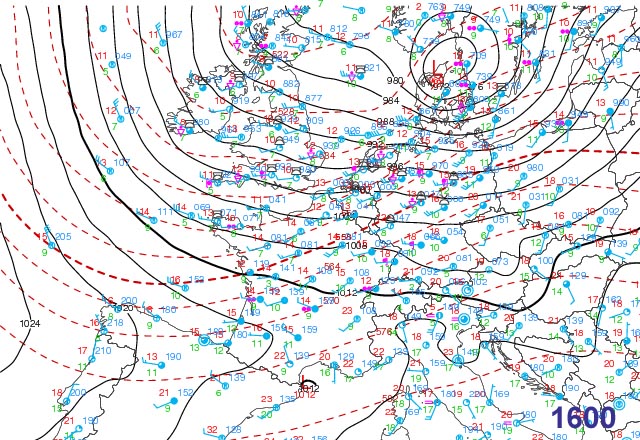
It is important to view any storm as an entity from its initiation through to its climax and subsequent filling, as opposed to how much damage it causes in any one country. In this case, much of the southern UK escaped its worst phase of existence, apart from the south-east, but its track across northern Europe was brutal. No doubt about it, this was one of the most intense storm systems to strike Europe in recent years. A close escape for us, then, apart from the area it was not forecast to affect i.e. everywhere north of a line from Aberystwyth to Humberside. It tracked a few tens of miles further south, but because such small, on the scale of such things, variations are beyond the resolution of the models, the Amber warning was justified in its entirety:
* it covered all possibilities with respect to the track;
* damaging gusts affected a wide area from Devon to Kent and Somerset to Norfolk;
* the likely sting-jet development made a bad situation worse - damage was already widespread before that;
* 40-50 mph gusts can bring down trees in full leaf when the ground is sodden and falling trees can and do kill.
Unfortunately, people clambered over one another on the morning of the 28th to protest on online message boards that this was all hype and a non-event. I could not believe my eyes: such messages were actually being posted as news of the fatalities was coming in. Worse, many people living well to the north of any of the very well-publicised forecast stormtracks were amongst the protagonists. Did they not read the forecasts? Or do they get all their weather information from the Daily Express? Does the fact that nothing has blown over in their back garden mean it's all cobblers? Do they not pause to consider why that may have been the case? Is their property sheltered from certain wind directions? Is that the sole boundary of their world? Or have we become a nation that likes information, regardless of the credibility of its source, to be spoon-fed and gulped down without digestion? These and many other similar questions I pondered throughout October 28th: if something so straightforward in terms of weighing up uncertainty and risk causes such a reaction, how on earth do we communicate the far more complex and far more serious issues of climate change?
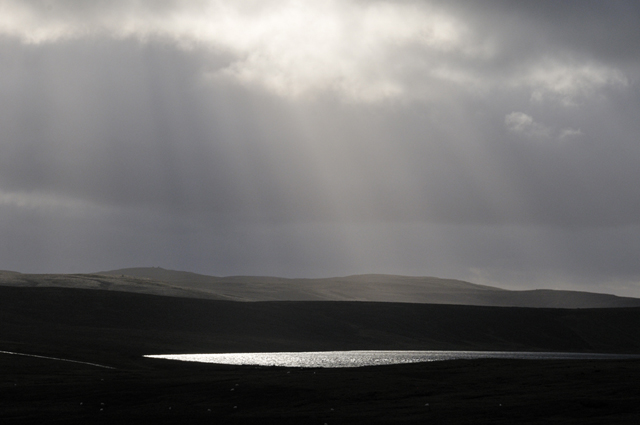
That afternoon, dark clouds parted momentarily over Glaslyn:
The natural world can be beautiful to behold, but it all operates by the laws of physics, the self same laws that, with the complete indifference that they have, led to people being crushed to death in their cars earlier that day. The better we all understand such things, the better informed we are to assess the hazards that exist around us, varying from hour to hour, day to day, decade to decade, century to century - and the better the odds of us avoiding or at least minimising the risks. More soon...
BACK TO WEATHER-BLOG MENU
New! Fine Art Prints & digital images for sale-
Welsh Weather & Dyfi Valley landscapes Slide-Library - Click HERE